Introductions

My name is Lori and I work for Nottinghamshire Healthcare NHS Foundation Trust. They provide mental health and community physical health care. Within this I support Liaison Psychiatry which has two clinical components. The first is Emergency Liaison where the team supports patients who present to the Emergency Department or who are admitted to an Acute Trust bed. The second is outpatient appointments looking at the overlap of mental & physical health. In this role I am not in the core team of analysts and then I got nicknamed by a coworker as an analyst in the wild. In my team there are other analysts (who are R wizards), our team is a mixture of people from all over the trust that in addition to their other roles.

My background is in Genetics & Bioinformatics having gained a BSc & MSc in them respectively. I was taught R at university but the teaching style didn’t suit me. It didn’t pass the “so what” test (I could do this in R but so what, was faster in excel). Since starting in healthcare I have gained a lot of knowledge and experience, more importantly I have gained a true appreciation. I am still at an early level having only been in depth for the 18 months.

Currently alongside regular reporting and random ad hoc requests I have a few interesting projects on the go. I built an internal monitoring summary for each of my teams. I am working on continually adapting this to best meet the teams needs. I have also been working on projects with a consultant to do regression modeling on patients who Did Not Attend as well as using software called UK CRIS to identify patients. More on these as time goes on

All Views are that of my own and not of my employer

Data Clinics

Our team recently piloted data clinics within the Trust in order to:

  • Improve data quality and completeness
  • Improve the means by which staff collect and record the essential information, making it more efficient and freeing them up to spend more time with their patients.

This was achieved by going “back to basics” with the people who collect and input data, the key principles are ensuring they know why they are collecting the data, making sure the data collection system works well for the teams and that the data can be used by both the data collectors and analysts. A variety of avenues were considered, such as reducing excess data collection and reducing duplication which make data gathering more laborious and tedious for clinicians.

When data collection is difficult for clinicians it often results in the data not being filled properly, correcting this increases the accuracy and completeness of the datasets. Structuring clinical records and decreasing their reliance on free text input is also beneficial for data analysis but is also often faster and easier for clinical staff. The clinics are a collaborative venture with the clinical team and others such as analysts and system admin, the type of staff varies depending on the needs of each teams. My role was to facilitate the conversations using skills learnt from working closely with the clinical teams to learn to “translate” between clinical language and data/IT language. Subtle differences in expression between the two groups often lead to misunderstandings which could stifle progress (more examples). The key element was that the problem was generated by the team themselves. This ensures that the clinic is focused on solving their difficulties which should help them to improve their own systems rather than forcing a change on them.

As a test run we had two teams go through the process:

  • A forensic mental health team which wanted to move away from using Excel to collect their data
  • A community mental health team which wanted to collect some extra information to better understand the impact of their team without adding too much to their workload

The forensic team was a new service which had a lot of data requested of them and they wished to improve their data collection and assess its quality. The Team Leader had used team-specific forms in RiO (the clinical database which they use) previously and was interested in seeing if it was possible here. However, they were having a tough time explaining to the managers who were not familiar with such a system how to approve it and get it built into the system. The spreadsheet was found to have a lot of duplication and data being requested that was not necessarily attainable by the team. We looked together at what the purpose was and changed some of the data from free text to a more structured pick list from the valid values for that piece of data. We also had to explain to the managers that this change was not going to affect their reporting adversely. The patient record system was able to provide the team with what they needed and to automate some aspects to reduce workload for clinicians. Some outcomes measures already existed but others were not yet available on the system, an Excel sheet was made to collect them (an improvement over a folder in the corner of the room) with a reduction in demand for clinicians with simple automation of score summations. The team are thrilled that they can collect the data necessary for reporting and understanding their service in a more intuitive way, project managers are content they are getting the same information and more data is readily available for service improvement. Reports are being built which give the clinicians easy access to data which allows them to engage better and feel ownership of the data.

The community mental health team wanted to collect some more information to improve their ability to understand their outcomes. They needed to be able to distinguish between the cohorts of patients that were being referred. This ended up having a simple solution that had not been known to the clinical team – adding in more specific referral reasons. The patient cohort was clear and defined and could be determined at referral. They wanted some more information on one of the cohorts to understand the group further and to see how specific patients within the group progressed. To gather this data, a short form on the electronic patient record was created which takes one minute to fill in but adds a wealth of information. The team also got to play with the form before it went live to gain familiarity and to help them feel ownership of it. They also wanted to be able to predict when referrals may come in. As we got to know the pathways that brought patients into the service, we learned that we had information about patients in the previous stage of the pathway. So, we managed to collect some information to understand the time between the previous stage and the referral. This means we can see when there is an uptick in people passing through the previous stage and predict a spike in referrals for the team to prepare for.

Lost In Translation

I really upset a clinician recently. I spent ages building this system to let the team know when they were due to get Patient Reported Outcome Measures (PROMs) from patients. It came up with quite a few for this clinician as overdue and to give her credit she has a good system as to when to ask patients for it. She knew a couple were overdue but not the 8 or so showing and the 2 patients with no PROMs ever completed.

When we discussed this a bit more and about our assumptions I realised something, we were using the same words but with different meanings. Not massively different but enough to create an issue. I then realised how often this can be happening and causing difficulties.

First up was the definition of month, as a team they have collect the PROMs every 3 months. So the clinician, in a very typically human way, was thinking in calendar months. If someone had PROMs completed in April, they would then be due in July. This makes a lot of sense, however computers (and computer minded humans) don’t always think in this way. A month tends to be considered as either 4 weeks or 30 days. So patients with overdue PROMs are the ones who have had 90 days elapsed since the last one was recorded. So a patient who had it completed at the start of April by mid July they will be classed as overdue to the computer. However the clinician had it though of as just July. We knew that they wouldn’t be completed at exactly 90 days (we are allowed weekends and holidays don’t fret!) and some may thus be at 100 and overdue for a bit.

Next up was the definition of a seen contact, this may be more specific to our system but I only counted referrals who had a “first seen contact” attributed to them. Patients should have a set of PROMs completed at their first appointment. This tends to be done very well so our high number of patients without any completed didn’t make sense especially with this clinician in question. We looked at the patients more closely and realised that there is an option called “Face to Face – Patient Not Present” that is used a big ambiguously and some staff manage to have Did Not Attend as the outcome (I do want to find out how this is possible). In this team it is used as their MDT. When a patient is discussed between members of the team and then it has an outcome attributed, the system then counts this as a “Seen” contact. I went back and excluded all the patients whose only Seen contact was this type and removed them from the table. This then meant that the data was a truer reflection of the team.

By this point the list was looking a lot better to the staff member and we all had a clearer understanding of one another, but it got me thinking about other terms like this

Last Year is another example, given we are in August 2020 if someone says how many referrals in the last year? Does that mean the last 365/366 days with today or yesterday being the last day. Does it mean 2019 or even 19/20 Financial Year. Everyone has different concepts depending on the type of year they normally think of. Which could cause two people to produce different number or use the number of different purposes with the incorrect assumption as the time period this covers.

In Healthcare and Commissioning there is a lot of talk around contacts and activity, when first in post there was challenges because what we reported our contacts as didn’t match the contacts the commissioners were seeing from an unknown source. The challenge came from contracting and finances. We had contracted and non contracted contacts. A patient contact was defined as one or the other depending on where the patient lived, the medium of the contact and the length of time it went on for. Our numbers always seems too high because we reported everything we did with patients without consideration into where they resided. As a service (particularly my area of Liaison which is people arriving in A&E needing help, you aren’t going to check if their responsible commissioner is in or out of contract as a clinician)

There are plenty more examples of instances where this does occur. I was glad to sort it out with the clinician as it breaks my heart that it painted them in what seemed like a poorer light when they were doing everything in their power to keep on top of this. As I have said for HSR UK (https://hsruk.org/conference-2020/sessions/methods-using-and-linking-routine-healthcare-data-maximising-opportunities see me and other lovely beings talk here) and other places. That assumptions cause issues and sometimes the fundamentals like what does a month mean to you need to be considered when extracting data or building such a system (which I hope to write a blog post about soon)

Maintaining Analytical/Clinical Relationships during Chaos

We have been in this “situation” for a few weeks now. We are all at different stages of this experience and it has brought change to everyone whether that be big of small. Personally, I am in shielding in my little city centre flat, 4 fluffy companions and a half way kitted out desk.

So as someone who typically spends a lot of time talking to/annoying/lecturing/babysitting clinical staff what is happening. Primarily a lot go my whinging about how I miss them (I can get sappy at times okay!). I want to be with them and support them in any way I can, even if it is just saying hello and checking in. I last saw the clinical teams on the 13th March. So what is happening? I am going to tell you the 4 types of people I have been finding in relation to data. Then I will talk about general tips.

The keen data clinicians
These will be ones whom have always been receptive to data and so will maintain this. The questions are now more likely to be related to the common situation but not exclusively. There are plenty of “normal” questions still flying around. Some people are looking for things to not be totally dominated by the pandemic if possible. It will depend on their service and how affected it is by the pandemic and how pressing other things are too.

The newly curious
This will be people that maybe hadn’t really looked at data before, but now either want to or have to. These will be really key relationships to nurture. If the power of data and combined working can be demonstrated they even after all of this that relationship can be maintained. They are more likely to be wanting to know about the pandemic as that is what has got them curious

The suddenly quiet
These are people who had been receptive to data but now don’t have time/desire to look into. Which is fine, this is a bizarre time for everyone.

The always distant
These have never been particularly receptive. Their desire to know about data has never been there and even now is still not, not everyone is data minded and their priorities will have shifted. Don’t forget these people though if sending information though.

So how have I adapted my relationship with them? In all honesty the way I work with them has changed very little. I have always let clinical staff “guide” how it goes. If you come on too forcefully you can push them away, this is not the same though as being enthusiastic but the two can overlap. When this started I contacted all the teams. Let them know about the daily/weekly sit-rep I was doing for them and asked for their input. I then let them know I would be working on various projects (mainly Year in Review but will discuss that another time). If they needed anything it would be a priority. I suspended a pilot project within the teams and then let them know that whenever they are ready we would restart it. We have had one teams re-accreditation suspended (with another one expected soon) but it had lead to investigation of the data just before this all happened. When the data was ready I contacted the key clinician. I let them know that I have the data ready, whenever they have the time we could do it. They were still keen so we are discussing it in the coming days. The staff members I knew a bit better I have been checking on in general. When submitting data, as the sit-rep goes to our trust, I have ensured to keep asking the team for clarity on provision, staffing, when abnormalities appear. In this stressful time last thing that they want is data about their teams being submitted without the right context.

In summary, now more than ever make your presence known, offer your skills (if you do not have an established relationship they may entail selling yourself but do it!) and give them a chance to comment on data and see if before submission. We have reduced our reporting but again the decision was made with the clinical team. It was to support them and reduce the stress on them. Also don’t forget the new relationships you may be building in this time with the “newly curious”, they will hopefully stay curious after all of this is over”

To-do Lists

There will be lots of people talking about how to work from home etc. To-do lists are brilliant and I know very helpful for me but there are lots of different ways, I can get very obsessive over to do lists etc. I do not have OCD but there are other conditions which can cause very similar challenges.

Some people may detest to do lists, other people are entirely reliant and then others may fall somewhere in the middle. I have to be careful with todo lists as ones somethings is on there I can’t remove it again. Particularly on a daily to do list.

I actually have a few templates from the designer Katie Abey (who I would totally recommend you checking out, she makes a lot of merchandise and is currently donating free posters to places in this current crisis wig positivity messages). The main aspect of todo lists which is key with any style is to ensure that the tasks are in small chunks. The todo list I show below is technically one task. PCPM PROM (Patient Reported Outcome Measures) reporting, by breaking it down you can tick more off which helps with motivation and realistic tasks.

This is the to do list I always have against my computer monitor. It is brightly coloured which is always nice but this has my general tasks on it, when someone makes a request they end up here. When I have a moment I can pick one to work on. In many ways I find this the most useful as I know I won’t forget but without the pressure of immediate need (for these tasks at least). This was for one project I recently finished this round of requests.

Rainbow coloured long thing pad, entitled “Pad of Productivity”. There is a variety of creatures next to each section of white bubbles for the todo list, there is a firefly, a watermelon saying “Go You”, a snail with a rainbow shell saying “Keep Going!”, a pig saying “Wow”, a pufferfish saying “deep breaths” and a cat with horned helmet and shield saying “You can do all of the things!”​. I have used the notepad to list my tasks for a project, all of which have been ticked off
Katie Abey pad of productivity with my PCPM PROMS tasks

Another todo list is this weekly planner. It is very helpful to keep things very balanced of being “productive” but also looking after yourself. The designation of more and less important helps with flexibility. If the less important can’t be done for anything it is not then the “be all and end all”. It also encourages you to do something for yourself.

Another way to form a todo list which stops excessive pressure of completing everything on it and thus helps with flexibility. We used to have a teacher who would do this with tasks in class. You split your list into:

  • Must do
    • These are tasks that must be done today, depending on deadlines etc
  • Should do
    • These are tasks that if the day doesn’t go entirely wrong should be achieved, so things which are due in a few days so have a back up time to achieve it
  • Could do
    • These are your ideal tasks. If they get done great, if they don’t get done today then there are no consequences.
  • Might do
    • This doesn’t have to be a section on the to do list
    • These are the tasks which can keep you busy if you happen to have time

Finally as I need routine I have had to design something for this current period of time. I have a blank page as an example as I have medical aspects on it. I have a schedule part, I don’t put tasks in every time period to encourage flexibility and then keep some to do things without a set time for when I have free time (or it is a good time to play on my switch both valid!). I try to add some positivity to it with the gratitude and positive bit but without wanting it to delve into toxic positivity. There is still a lot of moaning here trust me! I am counting down what is hopefully just the 84 days of shielding. I added in the day of the week because I spent a lot of days unsure what the day of the week it was

Anyone else use a different type of todo list?

Keep safe and healthy everyone ❤️

Data + Context = pt2

Last weeks blog post was explaining the analogy I use to describe the relationship between data and context (Data + Context =)

This was ideal world where the foundations of data built the house clinicians were expecting. However, what happens when things don’t look as one expects them too. Clinicians are best placed to know how things should look but they are not always correct. Sometimes the foundations available may not support the house envisioned by others. There are several reasons for this.

One is what I call at work the CAMHS effect (just because that is when I first observed it, nothing more). The teams thought they were seeing a massive number of under 18s and complaining about it (a lot!). So we did some digging. The numbers ended up being significantly smaller than they made out to be. This is because when they did see an under 18 it was so unusual, so different to their typical work and had a lot of other complications with it they were disproportionately memorable to the hordes of adults they were seeing. I think this is why roadworks feel more frequent then they might be because it is different to our normal.

Other reasons are wishful thinking, which we are all guilty of. It could be a new initiative has come into place and people were hoping for better results than there were. These things happen we don’t truly know an outcome until we try. It could be that the benefits are better seen in a different metric not previously considered.

Another is incorrect use of the front end system. Where people are not completing records and that affects the foundations which can be built.

So what happens in these situations?

The most positive outcome is everyone takes a step back and has a look, do we need to look at more variables to build a better base, have we got plenty of foundations but not enough context or understanding? Or is it just what it is, unexpected but we all move on with it

The problems come when results upset people. Not in the malicious sense but when you put a lot of work into something you want a positive outcome and it is only natural to be disheartened in these cases. Sometimes it will be tackled as above and other times the dreaded question will be asked of the data human “is there anything you can do with the numbers”. The simple answer is no, the numbers are the numbers. This is what has been recorded in the system. This question which can lead to tension in conversations can also be a brilliant springboard for learning by both parties.

It is a good chance to walk the clinician/manager through the data available and understand where the number has come out (which may highlight an oversight by the analyst which is great and can be sorted) but also a good opportunity for the staff members to talk through how they are using the system. Explain clearly what each bit of data they input, how that corresponds to a patient and their progress.

When the data is missing, and there are many innocent and less innocent reasons as to why data may not be being collected fully, it leaves everyone in a predicament. There may be a way to manually trawl the data (which I will only do in exceptional circumstances in small numbers when the reason for the manual trawl is being addressed e.g. there is now the needed data box moving forward), but this is majorly time consuming. In there cases it is often best to work with what you have but focus on addressing the issue. In my post MHSDS I talked about trying to improve completion rates of non-mandatory fields and various tactics to address this.

A key reminder, particularly to the less confident analysts, you may have to tell clinicians/managers etc that they are wrong. Make sure you have checked yourself but the relationships around healthcare data mean everyone has their area of expertise. Yours should be the extraction and manipulation of data. Just because a clinician says the data is wrong doesn’t mean it is. “Wrongness” in data often comes from mis understandings. Especially around targets and payment by results teams this can be a touchy subject when things are not as expected, but the better the relationships between everyone the more trust there is.

Data + Context =

This is just a short post to explain the analogy I use to describe the relationship between data and the context in healthcare. That is it is like a house

Data is like the foundations. They build everything up nice and solid. This ranges from numbers and graphs to case studies. When you have the foundation you have a very solid start, but not much to look at.

The context provides the story, this is the actual house you see above ground. It is the “meat” of the story and the bits people need to understand and move around to make any decision or gain any understanding. However if it is on poor foundations it won’t stand up to enough scrutiny and can soon topple. This is where things like team size, skill, working times alongside patient population, demographic and need come into play.

Sometimes it is necessary to have one without the other. Sometimes all you can build is a solid foundation but it is a good platform for future work. Other times you need to build a “shelter” temporarily even if it doesn’t have proper foundations, that’s not to say it is useless or wrong in any way shape or form. Things are best when you have a combination of the two. Which is where building relationships with clinicians in healthcare (or equivalent in other industries) is vital. They will know what the house should look like. Analysts can ensure that the foundations are there

I’m available!

Before anyone gets weird I am not referring to dating. At the NHS-R when asked what were some of my tips to get clinicians more on board I said about being flexible and available to them more on their terms. So I try and just have a chat with people even if about the weather to be approachable. I pop into the office ask how things are going and then people are more likely to ask “oh by the way….” and either give me a bug report or ask a question. With most of the team going through re-accreditation we are having to look at data more closely with new people.

We had a new team lead and apparently in hand over to the incoming they were told not to under estimate the help I was going to be. A couple of weeks in they said they hadn’t realized what I get up to. I am working on letting more of the teams to know.

The real reason to make this post relates to a phone call with one of the medics. We were having a chat about various things and currently in Nottingham there was been chaos with a major bridge on restrictions and driving has been a nightmare. So I said I wished I was visiting team that week as they are housed “my” side of the bridge and away from the chaos. To which they replied “I wish you were coming this week too”. Which is unusual. They are normally very quick to call/email etc for help. So I said well I am here on the phone lets try and sort it. The concern about the phone call had only been due to this being such a new data metric and how to present it. So we went through the key questions

Who needed to see this metric now. We only had 3 months of information in it so why the sudden curiosity?

We assessed it was less about the specific patient journeys and more about the general cohort. So managed to account for it. We then looked at who needed to see it to consider method of presentation.

This process would have been much quicker had we been co-located and that is what they were after when saying they wanted me to visit sooner. I wish I could visits each team more but there are only so many days of the week and sometimes you need your own office rather than hot desking everywhere. Between 6 (potentially soon 7) Liaison Teams, my own team and the need to work from home. So I try and visit each team at least once a month physically and then emails and calls in between.

Never under estimate the power of random hellos. If you had a question and worried you would be seen as stupid for asking (my clinicians and anyone are never stupid for asking), would you rather ask the person who smiled at you or the stranger the other side of a keyboard?

1 Permanent Year

The 12th February 2019 was a momentous day in my calendar. I should probably acknowledge my younger brother turned 21 that day too but sorry kid my day was momentous too (I think I am more likely to remember the day than you too!).

After 17 months on a temporary contract I interviewed for the same role I had. Although relatively confident with all the funding problems there was some anxiety around it. Thankfully, like the first set of interviews a decision was made same day to offer me the contract on a permanent basis. The process happened quite near the end of the temporary contract due to funding. The monies which paid for me (as well as a large number of the team) had been short term rolling with last minute decisions. So it had taken a while to find an alternative source as everyone else was on permanent contracts and thus could be redeployed. During the interviews (as there was another applicant) an email was received stating that all teams had had their monies made permanent. Which was the second bit of amazing news for us all. There had been months of putting in the bid for the money follow by 20 months of having to prove it was value for money and being spent properly. For it to then be renewed just a few months at a time. Prior to it being made substantive this had taken up vast amounts of my time.

While still reeling from all this excitement we had one more notification come through which was being listed as a finalist for the BMJ awards for the PCPM (Primary Care Psychological Medicine) Project. This had already been previously listed for an HSJ award too. It is safe to say we finished the day just a little bit giddy.

So now that the monies were made permanent and that had taken up a lot of my time. What happened next? We could finally start being proactive. We could look at more interesting things than fighting fires when chaos happened. Chaos happens still, there is no doubt about that but slightly less than before.

I built my internal monitoring reports for my teams. This allows us to look at things monthly to try and see if changes are beginning to happen before they become overly problematic. It was also a good “bonding” opportunity. I sat down with the clinicians and learnt more about what concerned them. What changes had they noticed which was having an impact on them (for better or worse) but also what could change that would impact on them. So each teams is slightly different. I wanted the clinicians to feel heard, when working in such a busy high paced environment you don’t need much change from the status quo for disaster to strike. This also highlighted some problems with service equity. They had gone under the radar not due to malice or lack of care but everyone was so busy keeping the department floating no one could see past

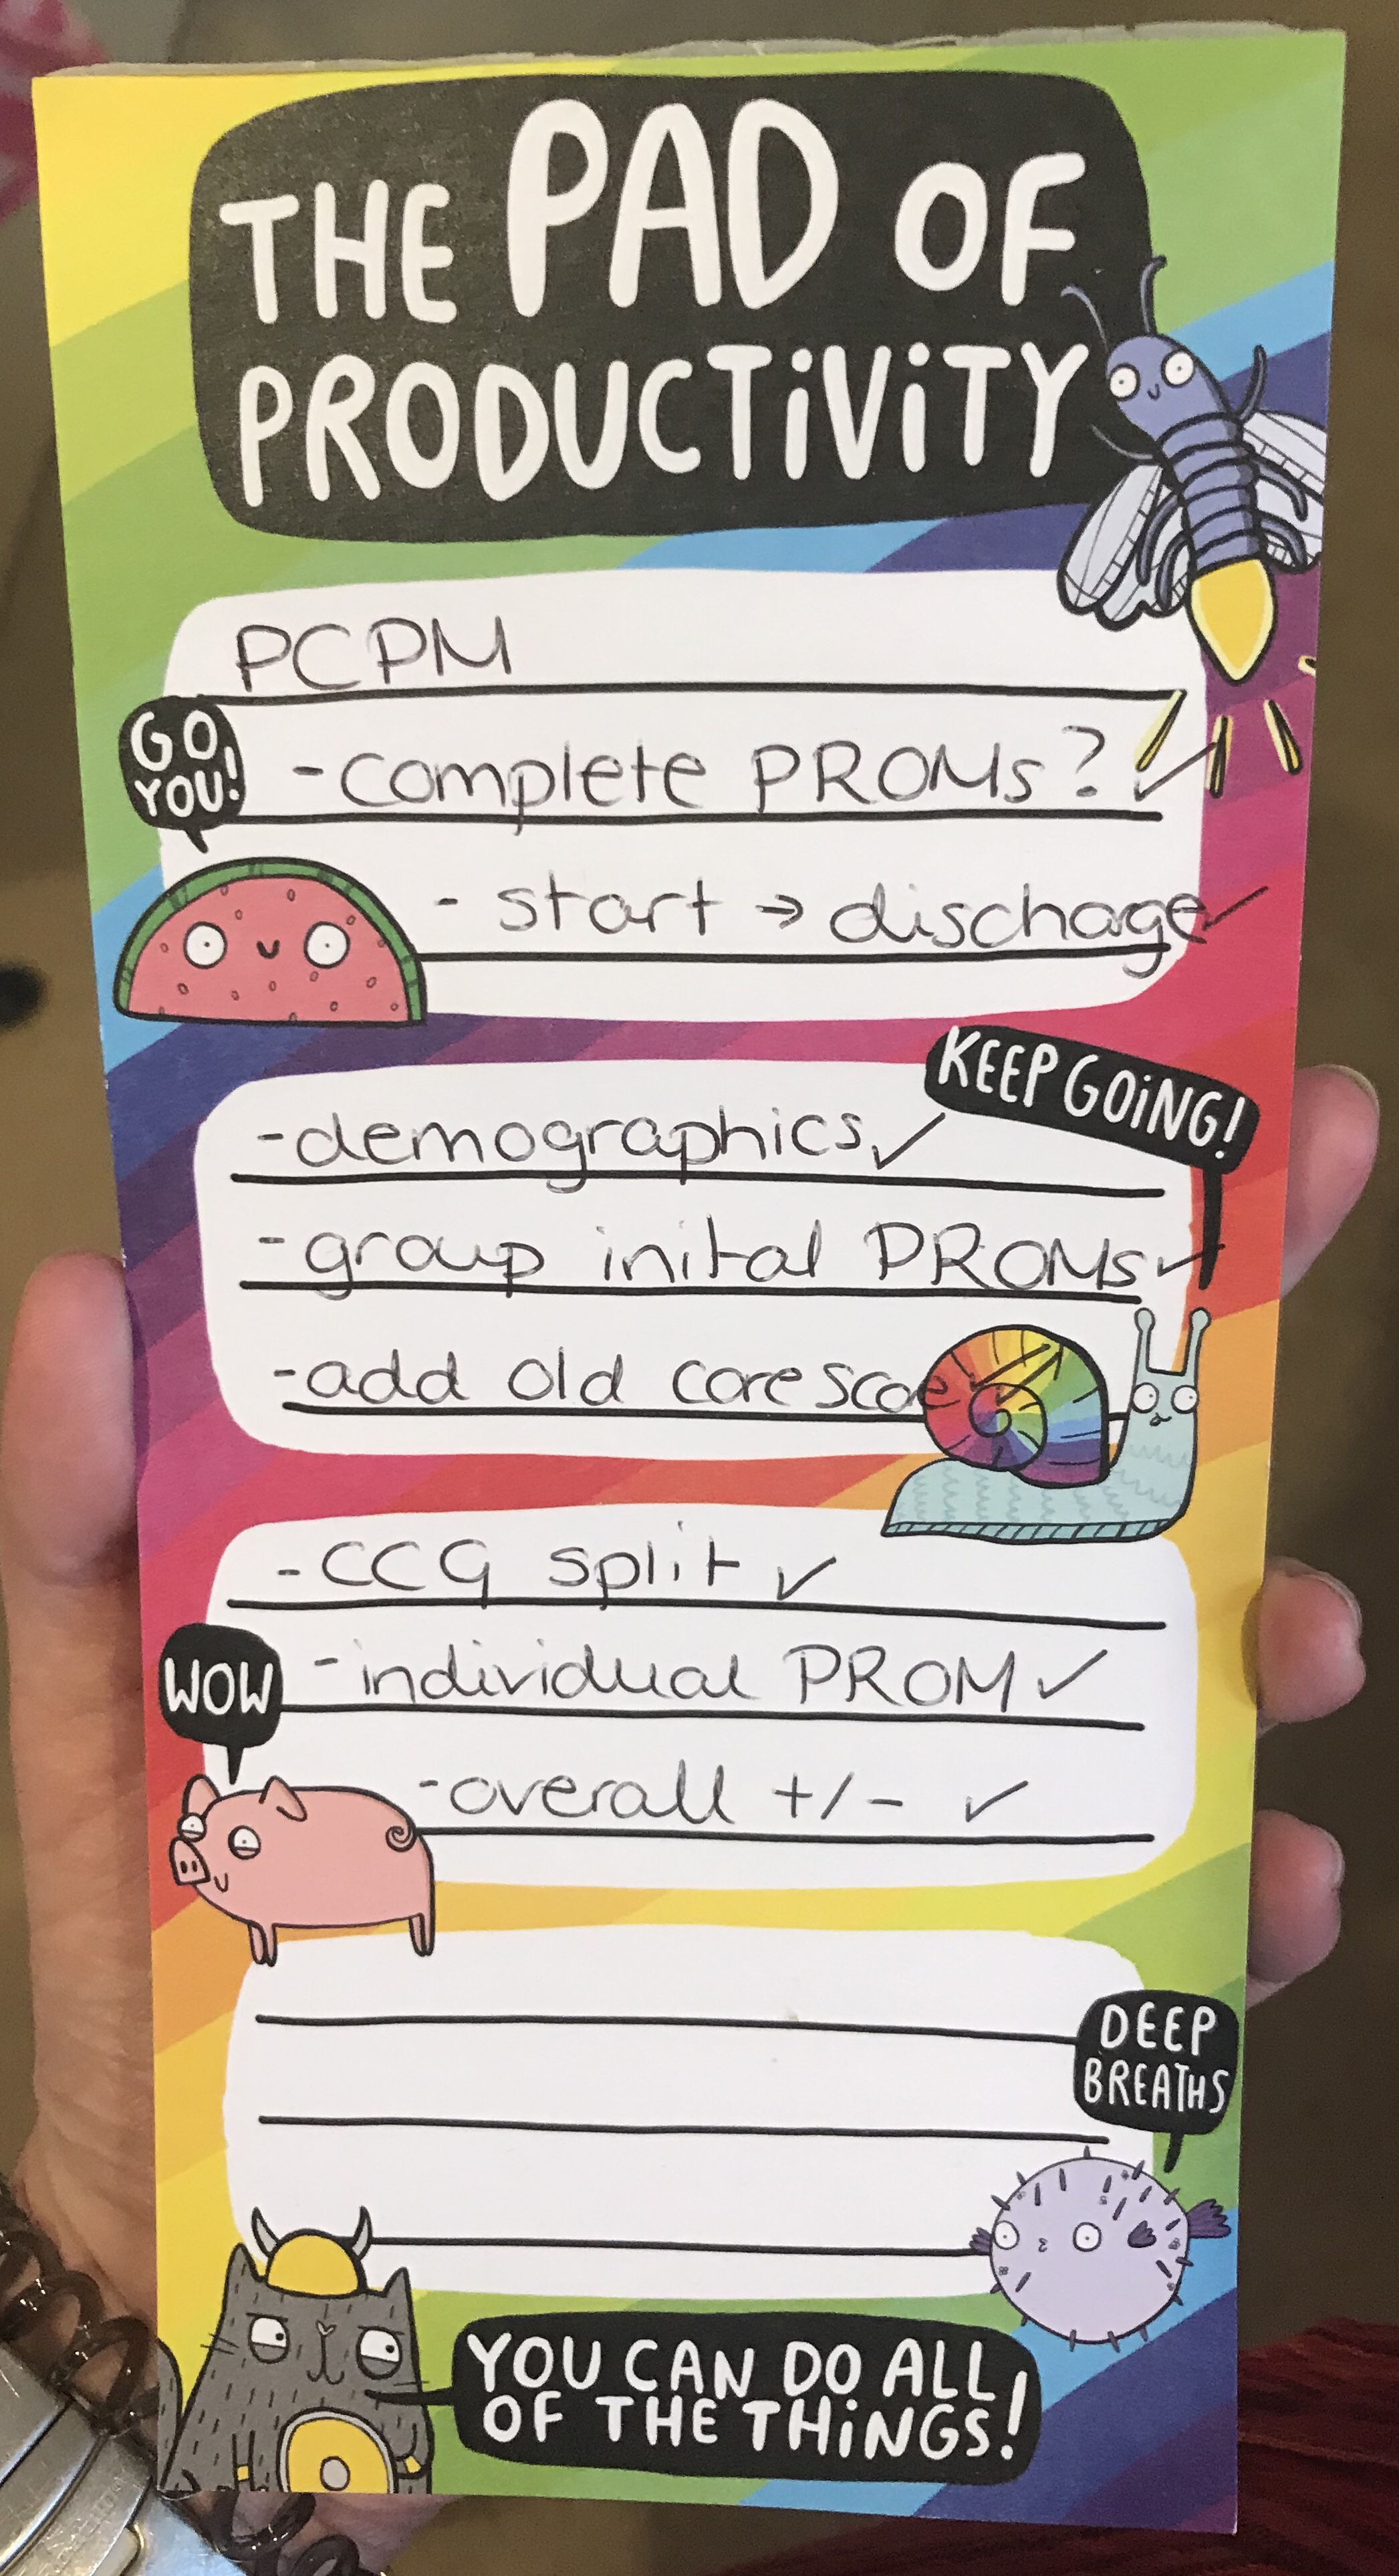
PCPM also progressed a lot. I had been on the project a while already however this was the year progress was made. Shortly after the permanent contract is when the nomination was put in for AphA awards. This project really helped with my analytical skills. Not only did it prove to have some strong analytical challenges due to the time series of the patient cohort (everyone with a different start and end date), different lengths of time in service, the cohort had both engaged and disengaged patient, data was pulled from multiple sources and formats (including some weird date formats I hope to never see again in my life). The next aspect was considering the clinical side of these patients. When looking at service usage for this cohort of patients (Who are commonly describe as either medically unexplained symptoms, psychosomatic symptoms, persistent physical symptoms) you have to consider what can be influenced and what cannot. Pregnancy for example. Although the hope for after treatment at PCPM people would have lower anxiety and lower service usage, however pregnancy will always increase service usage even in traditionally “healthy” expectant mothers. So would skew the results. Same consideration was given to patients who had a car accident or cancer diagnosis. However we had to consider what clinically would be included or excluded.

The other new and exciting endeavor has been the training/talking/education. This all started with Chris B being asked if he knew any ladies who used R (and he quickly recommended Zoe and I). From that one talk I remembered how much I enjoyed such things. So then gave a talk at NHS-R and started planning other bits. Will hopefully be soon talking at a local APHA branch (that will likely be situated just a few paces from my office for utmost convenience, selling point for others is that it is near the tram too), will discuss my award at the APHA conference in Birmingham come September. I have been in talks with a local public health consultant about doing training at the university level for medical schools to improve medics understanding earlier. I am also running some CPD sessions in my trust for consultants.

Still on going is the planning for the HSR-UK conference. Our panel, which talks about using and linking healthcare data. Our assorted team gives a diverse approach to the data. With my focus as always being about the clinicians and inputting the data. How building those relationships are key to getting any meaningful analysis being done. I am practicing what I preach still. Jo (@Peet_Joanna) is a ward manager for the acute trust after jumping ship (not evasively!) from on of the Liaison Teams. We have remained in contact and share data and information to try and bridge the gap between mental health and acute trust. She is passionate about how improving mental health knowledge on acute wards has major benefits for patients. So we are presenting together (my data, her clinical knowledge/intervention) a poster in June.

Our research paper was submitted to a major journal and revisions requested. So I remain hopeful for that as it was not an automatic rejection. That will be my name on that paper officially and the start of hopefully many citations against my name.

A lot has also changed. Not all positive. I have faced many health challenges and they have knocked onto each other and impacted work. Far more than I wish it had. There have been a lot of changes in staffing, with some good people coming and good people going on. Becoming a cyborg was a highlight as it changed everything. It improved my life in some ways endlessly but has caused a significant number of problems too. I spent a lot of time off sick with it. A lot of time on the sofa (which is very good coding time for passion projects). It gave me a lot of time to ask other NHS staff about data. A habit of mine any hospital admission.

Looking forward to the next year. I am excited for the posters and sessions being run to improve healthcare data from both sides. I have met very few totally resistant people when it came to learning. A lot is meeting people half way and understanding the challenges. Often why is the more important question than how. I want to keep improving what is happening for Liaison in Nottinghamshire and how it affects the surrounding areas of healthcare. I have more R coding to build and develop including a current focus on PROMS. Health wise I am not after cured I am not deluded, but some stability would be a nice change!

How to build/answer a good data question

This can/will make or break your career as an analyst. You might be able to coast answering questions but the stuff that will make a difference to the company and patients requires this skill.

The first thing of this is that it is highly unlikely you can do it alone unless you have already a lot of experience in this specific area of the data which will become clearer

First we need to check if our question is in anyway useful, this is the time to focus on why is it being asked, what benefit is the asker hoping to get from the answer. How often will they need it, I am always curious when people want a once off piece of data. Unless it is a top up context to something else how does knowing this fact 6 months ago without then renewing it help. You want that information to see how it changes due to a change in clinical practise or staffing or location etc. If the data is not to monitor change which then needs repeating what is it for. Research can be a once off but even building models for predictive analysis you do split it so it is like having multiple data points. You would want to then see if implementing the model though had an impact on clinical practise so would need data later. This allows for discussion as to is that question going to get them the answer they need, a consideration into population, time frame, metrics and more, you don’t need to finish finalising the entire question here. Next you need to look the data available to you to see what could be answered.

We need to consider the Flow of Data we have referenced a few times. When a question is asked you need to know who is the patient population in query. Is it everyone coming through the trust ever, just a team, in what time period, is it current case loads. Then we need to consider that there may be errors, such as incorrect referrals, people who should have been discharged from case loads who haven’t (I have seen someone who is 29 and supposedly still open to CAMHS!)

The next part is who holds the data and who is responsible. We need to be open about data but still need to be aware as to who is seeing what patient data and why. If someone works on a perinatal Ward suddenly wanted to know about where patients who were referred to the memory assessment service (two teams that do not overlap) then some questions have to be raised as the need. Teams should also have some insight as to what is happening with their data, firstly as it is their team but also if they understand it is being used for stuff that will benefit everyone it helps improve data input accuracy and completion rates. The people who input the data are also 100% the experts in what they use each box for. As I explained in previous posts and when I give talks different teams have different habits that you need to be aware of. Your assumption as to how a field is being used is useless compared to asking the people who do it.

We then need to look at does the metric exist entirely or can a proxy measure be implemented. An example we have for this currently is ‘time mental health bed called’. This is not a field anywhere in our electronic patient record, however knowing the clinical behaviour we know a bed is called if needed as soon as the assessment by our team is finished. So using ‘time assessment ended’ is suitable proxy. Some things may need to consider multiple metrics to come to a judgement. There are times where there may not be a proxy and so a judgement can be made using the clinical knowledge you have. Lacking numbers doesn’t make it automatically a “useless” conclusion. Arguably a numeric answer without any context or clinical story is as useless.

Then everyone needs to look at the answer, do you all understand where the data came from, do you understand what it is showing, is everyone confident in explaining the data. If you have gone through all this work it would be a shame for it to be explained poorly and the wrong message given. At this point either more conversation needs to happen or allow the analyst to attend the meetings (or analysts should be given more of a standing in meetings in general).

This may all seem like a lot of work, however, does it really compare with the risk of people mis interpreting information that could damage the patients, having to keep redoing a task or people using a judgemental decision when a combined one is possible. This is particularly key with long standing reports, a lot of damage can be done by a monthly report.

Someone once said to me they thought I spent all day at my desk, which is entirely not true. I reckon it is only 50% of the day on average. The rest of the time is phone calls, popping into offices, meetings. These allow me to build the relationships I need to do comprehensive analysis, to showcase the results we have found and keeps me approachable for the more ‘timid’ of my clinician, coworkers to be able to ask questions.

Where have I been?

So took a bit of an unplanned hiatus from here. Life just got a whole lot more complicated than I had planned

I didn’t fully recover from being unwell over the summer which took a lot out from me emotionally, mentally and physically. I am also not great at pacing as after a month in hospitals (plural I moved a lot) I went back into things very fast, I have no regrets but travelling to Leeds for the a Key Stats 2 course 10 days post discharge and Manchester for the APHA conference day 2 a week later did take a lot out of me.

Then as I was getting to being recovered I then had a set back with my asthma and had my inhaler a changed which took some adjusting to and in the interim ended up in hospital due to an uncontrolled asthma attack and then didn’t sleep that night I was admitted which helped.

Next I had to start preparing for surgery which took a lot of doing, only for at the last moment there to be a change of plans which caused a problem in itself, the first plan would have lead to a shorter hospital admission but in an attempt to avoid hospital things went awry and ended up with a longer admission.

So what now?

I am hopefully on my last 24 hours in hospital. That won’t be confirmed till the morning (Monday 2nd). Nearly 3 weeks after my procedure. For now I am happy to report the actual procedure went well. Only time will tell if we get the benefits from this surgical revision.

I have kept myself out of mischief as much as possible both while here and in the weeks leading up to this. I did attend the NHS-R conference and gave a talk, have started learning about patterns in stocks and shares, continuing to teach a computer novice R (she is doing brilliantly and may read this, but I did spend 18 months having to be her excel fixer as she managed to break just about everything possible – R doing fantastic though). Got plans for the research projects ticking over in the background and trying to kick this blog back up. I have also recently purchased a Nintendo switch that I have been rather attached to.

When I do leave I am hoping the out of office has deterred most people from sending me stuff that can wait, we have a big project on my return for a national pilot that we are on track for (unless I have an email with bad news) I need to focus on without having to first wade through a barrage of emails, like on previous long times off work I always check emails out of hours so I can get through them without having more coming in at the same time and getting overwhelmed.